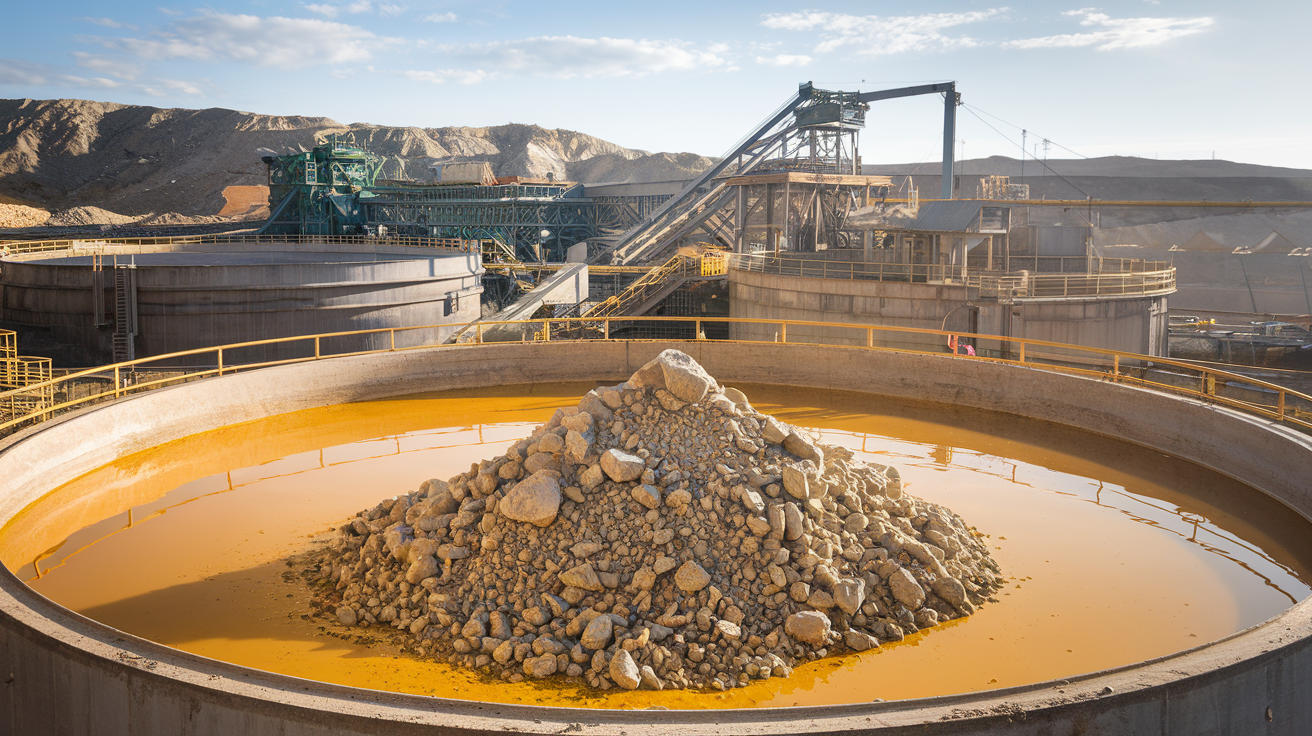
Gold mining is a complex journey that begins beneath the earth’s surface, where valuable resources lie hidden. One of the most important steps in this journey is rock excavation, the process that uncovers gold-bearing ore. How this excavation is done can make a big difference, not only in how efficiently the gold is recovered but also in how the surrounding environment is treated. From traditional methods to modern technologies, each technique comes with its own set of advantages and challenges. Understanding these processes is essential for anyone interested in responsible and effective gold mining, whether you are part of the industry or simply curious about how the treasures of the earth are brought to light.
What is Rock Excavation?
Definition and Significance
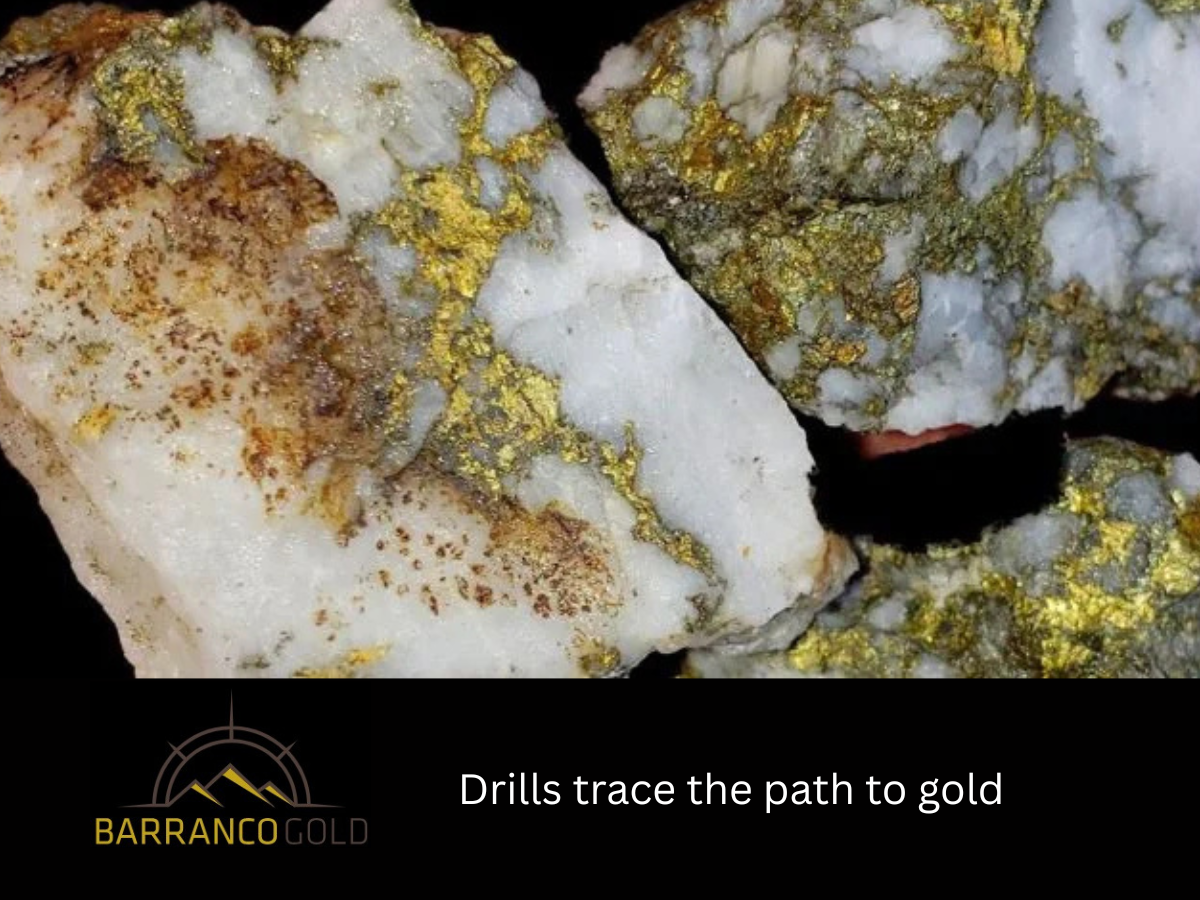
Rock extraction refers to the process of removing rock material from the earth to gain access to valuable minerals, such as gold. It involves various methods, including mechanical, chemical, and explosive techniques, all aimed at breaking down rock layers to expose mineral deposits.For gold mining, efficient Rock Digging is vital because it directly impacts the gold extraction of gold ore. As gold ore is often deep underground or covered by layers of rock, miners must use precise and effective methods to access these resources.
Importance in Mining Operations
Rock extraction is a cornerstone of Mining Operations and Equipment , especially in gold mining. The process involves removing vast amounts of material, including both overburden (the surface material that covers ore deposits) and rock, to expose gold-bearing ore. Without proper excavation techniques, accessing valuable minerals becomes inefficient and costly.
Mining Operations and Technology
The Role of Mining Machinery
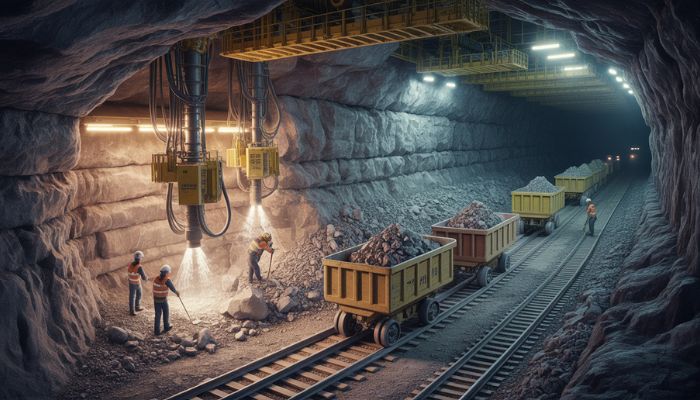
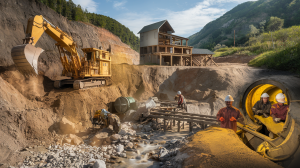
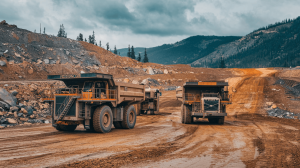
In gold mining, Earth Digging is made possible by a variety of machinery designed to handle large-scale excavation projects. These machines help move rock, break it down into manageable pieces, and transport it for processing. The key machinery used in gold mining includes:
- Excavators: Large, heavy-duty machines used for digging and moving rock.
- Bulldozers: Used for clearing land and preparing sites for excavation.
- Haul Trucks: Transport excavated material to processing areas.
- Drill Rigs: Used to create holes for explosives in hard rock.
These machines are crucial in enabling miners to efficiently carry out rock excavation and mineral extraction. Modern mining machinery has become increasingly automated, offering greater precision, efficiency, and safety.
Innovations in Mining Technology
Over the years, mining technology has advanced significantly, improving the efficiency and safety of rock extraction in gold mining. Some key technological innovations include:
- Automated Excavators and Drills: These machines can operate autonomously, reducing the need for human intervention and increasing precision in excavation.
- Real-time Data Analytics: Sensors and software that monitor equipment performance and provide real-time data to improve decision-making.
- Advanced Rock Breaking Techniques: New technologies such as non-explosive demolition agents and hydraulic splitting tools have made rock breaking safer and more efficient.
These technological advancements help mining operations reduce costs, improve productivity, and minimize environmental impact.
Exploring Mineral Exploration and Excavation
Techniques for Effective Exploration
Mineral exploration is the first step in any mining operation, and its success largely depends on accurate and efficient rock extraction techniques. Common exploration methods include:
- Geophysical Surveys: Techniques like seismic imaging and ground-penetrating radar help locate ore deposits beneath the surface.
- Core Drilling: A method of drilling to extract samples of rock and soil for analysis to determine the presence of minerals.
- Geochemical Sampling: Involves analyzing rock, soil, or water samples for signs of valuable minerals.
By accurately identifying mineral deposits, exploration ensures that excavation efforts are focused on areas that will yield the best results.
Mineral Exploration’s Impact on Gold Mining
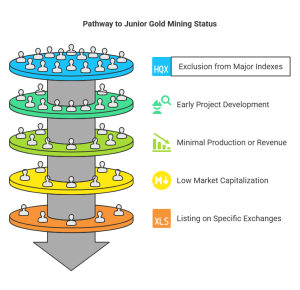
Effective exploration enables mining companies to identify the most valuable deposits and plan their excavation methods accordingly. Gold Mining Stocks represent investments in companies engaged in gold exploration, extraction, and production, offering a way for investors to gain exposure to the gold market without physically owning the metal itself. This is crucial for gold mining, where the presence of ore can vary widely across a region. Without proper exploration, excavation might lead to inefficiencies and wasted resources.
Techniques Used in Rock Excavation
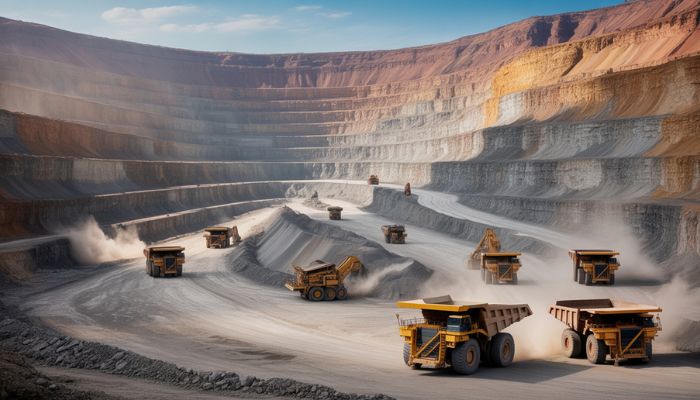
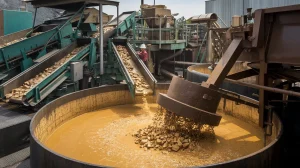
Surface Mining and Rock Breaking
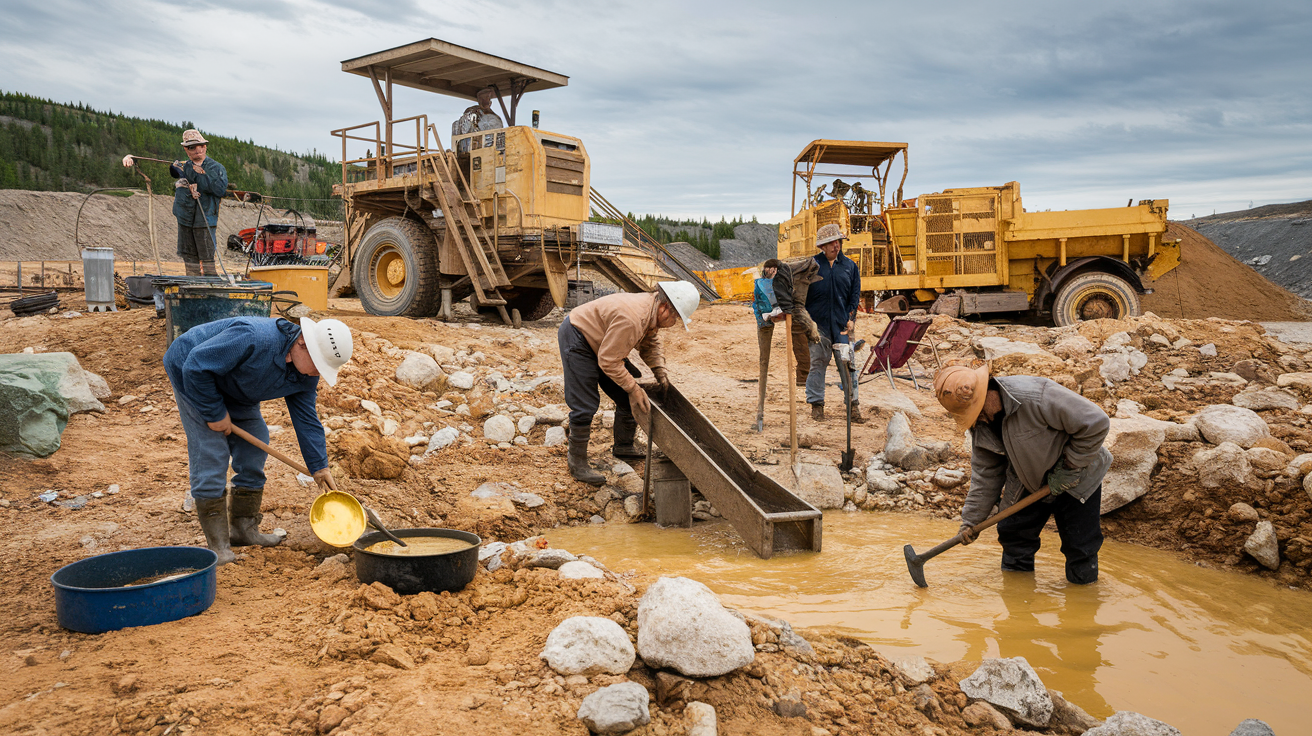
Surface Mining in Gold Mining is the most common method used for excavating gold, especially when the ore is close to the surface. It involves removing overburden and digging down to access the ore. Once the ore is reached, it is extracted using various methods such as:
- Drilling: Drilling holes in rock to place explosives for blasting.
- Mechanical Rock Breaking: Using crushers, hydraulic hammers, or even high-pressure water jets to break rock into smaller pieces.
Efficient rock breaking ensures that valuable ore is accessed quickly, reducing the cost and time associated with gold mining.
Drill and Blast Methods
In harder rock formations, the drill and blast method is often employed. This involves Drilling Techniques holes into the rock, placing explosives, and detonating them to break the rock into smaller, more manageable pieces. This method is particularly effective in extracting gold from hard rock deposits that are otherwise difficult to access using mechanical means alone.
The Role of Gold Mining Machinery in Excavation
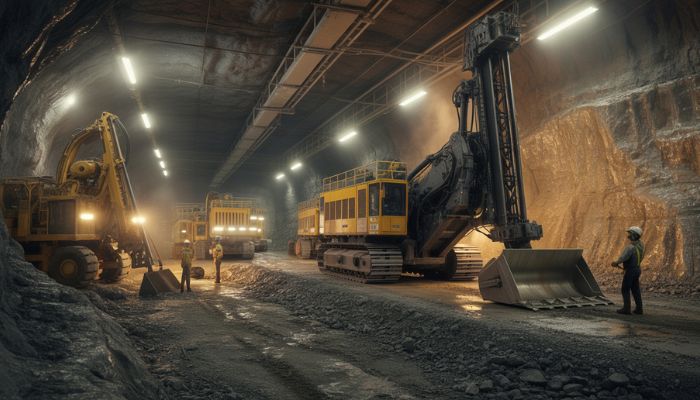
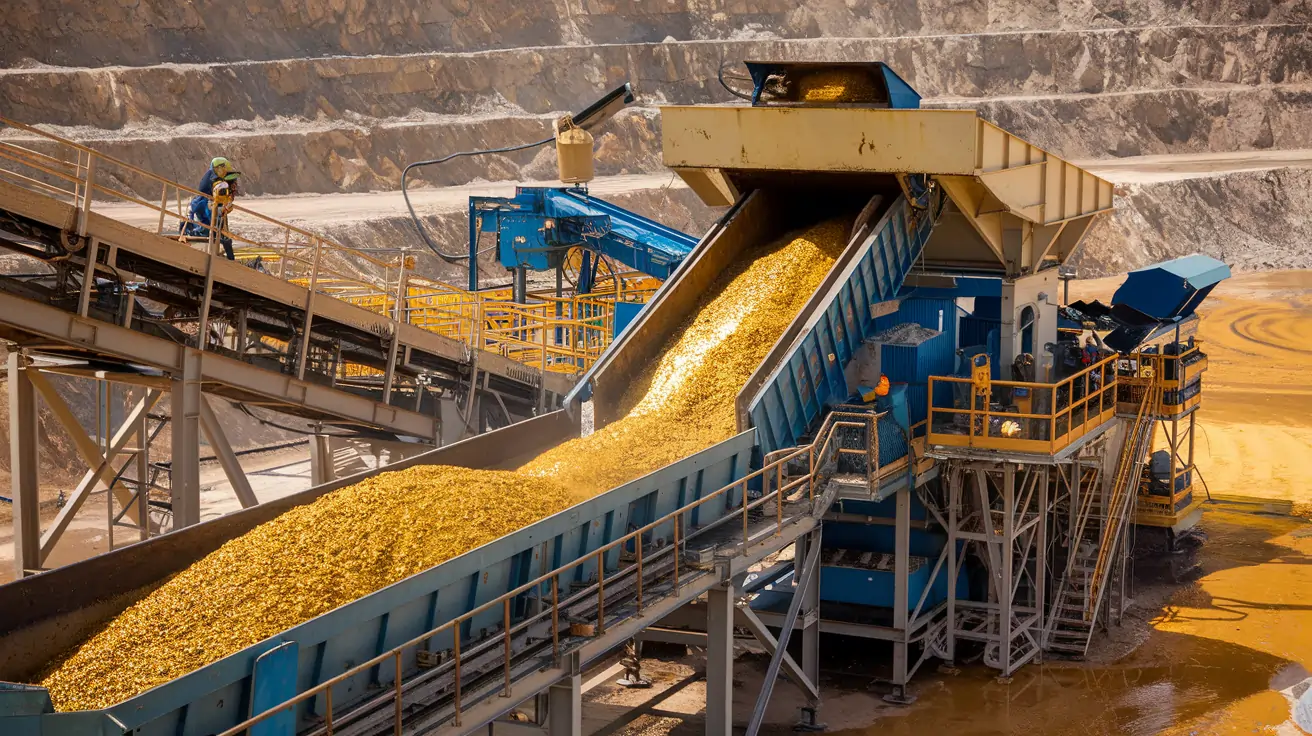
Types of Equipment Used in Gold Mining
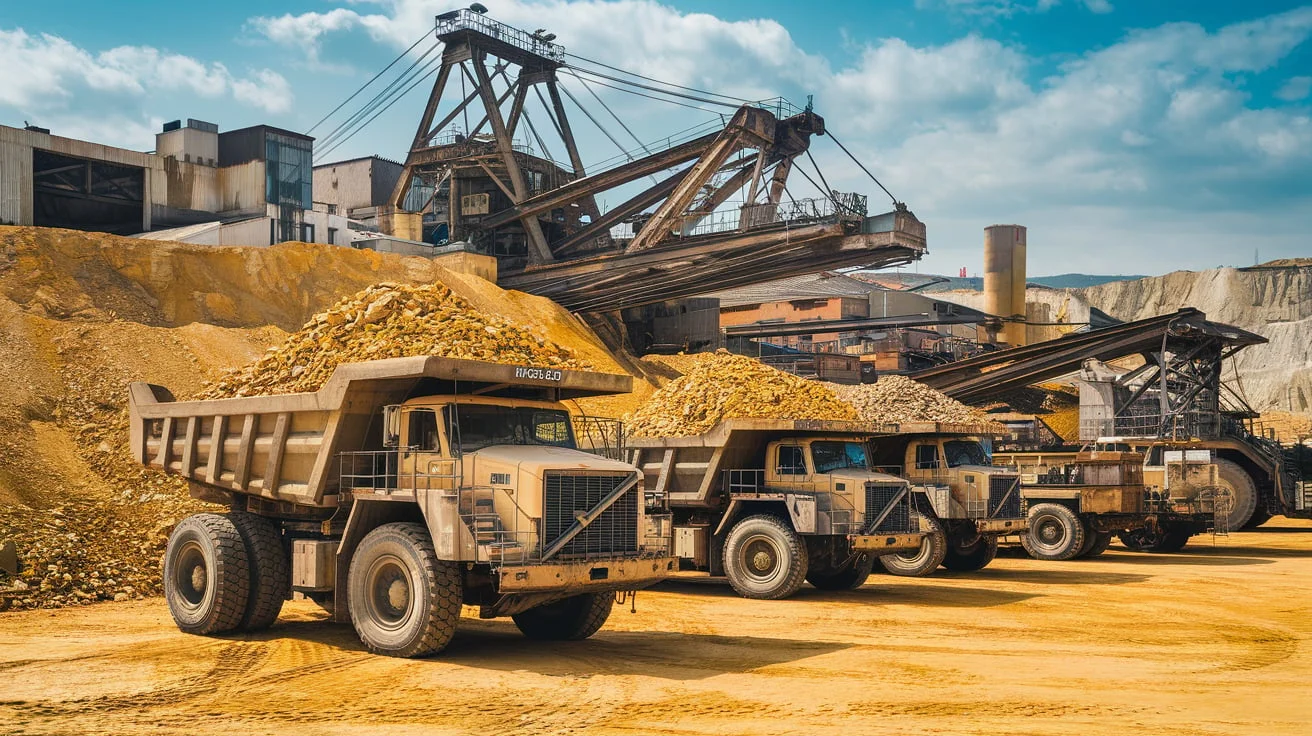
Gold mining operations rely heavily on specialized machinery for. These machines are designed to handle the heavy lifting involved in moving large quantities of rock and ore. Key equipment includes:
- Excavators: Large machines used to dig and transport rock from the excavation site.
- Drills: Used to create holes for blasting or core sampling.
- Haul Trucks: Essential for transporting the excavated rock to processing facilities.
With advancements in technology, mining equipment has become more efficient, durable, and capable of handling tougher conditions, making excavation processes more cost-effective.
How Technology Enhances Efficiency
Modern gold mining machinery incorporates technology such as GPS navigation, automated controls, and sensors to improve excavation efficiency. These innovations reduce human error, optimize equipment performance, and provide real-time monitoring of excavation processes.For example, automated excavators can operate continuously, reducing downtime and increasing productivity. Additionally, new machine learning algorithms are being used to predict and optimize excavation operations, ensuring that rock breaking and mineral extraction are carried out as efficiently as possible.
Benefits of Efficient Earth Digging in Gold Mining
Economic and Operational Advantages
Efficient Rock Removal is critical for the economic success of gold mining operations. It allows miners to access valuable ore more quickly, reducing the overall cost of mining. Moreover, technological advancements in machinery and excavation techniques have led to a reduction in labor costs and increased productivity.
- Cost Reduction: Automation and better equipment help lower operating costs.
- Increased Productivity: Efficient excavation methods lead to faster mineral extraction, boosting output.
Environmental and Safety Improvements
In addition to economic benefits, efficient excavation methods also reduce the environmental and safety risks associated with mining. For example, improved blasting techniques and equipment help minimize environmental damage, such as land degradation and water contamination.Additionally, automation and real-time data monitoring help reduce safety hazards by reducing human exposure to dangerous conditions.
Common Challenges and Mistakes in Excavation
Equipment Failures and How to Prevent Them
One of the main challenges in rock excavation is equipment failure, which can lead to costly delays. Preventative maintenance is essential for ensuring that machinery operates smoothly. Regular inspections, timely repairs, and investing in high-quality equipment can help prevent breakdowns.
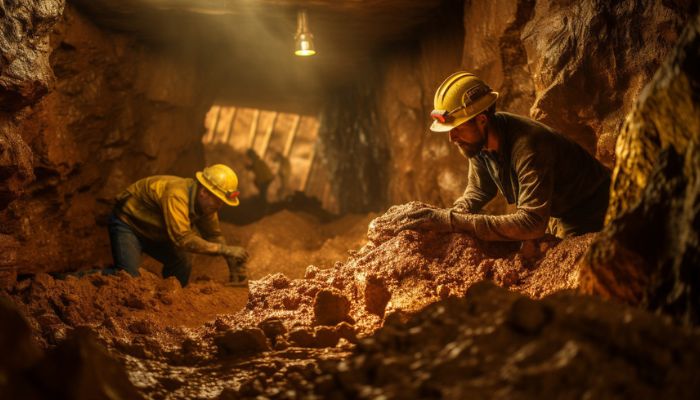
Safety Risks in Rock Removal
Mining operations come with inherent safety risks, including rockfalls, explosions, and exposure to hazardous gases. Ensuring that workers are properly trained and provided with safety equipment, such as helmets, protective gear, and respirators, is vital for preventing accidents.
Case Studies: Successful Material Excavation in Gold Mining
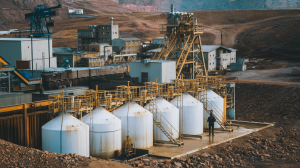
Real-World Applications
Some of the most successful gold mining operations have utilized advanced Ore Extraction techniques. For instance, Barrick Gold’s Veladero mine in Argentina uses cutting-edge excavation machinery and technologies to improve efficiency while reducing environmental impact. The mine employs automated trucks, drill rigs, and real-time data analytics to optimize excavation processes.
Future Trends in Rock Excavation
The Impact of Technology on Excavation Processes
As technology continues to evolve, the future of Material Excavation in gold mining looks promising. Emerging technologies such as artificial intelligence (AI), machine learning, and robotics are expected to play a key role in further improving the efficiency and safety of excavation operations.
Sustainable Practices in Mining Operations
There is an increasing emphasis on sustainability in mining, with a focus on reducing the environmental impact of excavation. Innovations in mining machinery, such as electric-powered vehicles and non-explosive demolition agents, are helping to minimize pollution and reduce the carbon footprint of gold mining.
FAQs
What is the best method for Rock Digging in gold mining?
The best method depends on the type of ore and location. Surface mining is typically used for shallow deposits, while drill and blast methods are employed for deeper, harder rock.
How is rock broken during gold mining?
Rock is broken using mechanical rock breakers, hydraulic hammers, or explosives in methods like drill and blast.
What safety measures should be taken during rock excavation?
Safety measures include using protective gear, maintaining equipment, and following proper blasting protocols.
How does technology improve gold mining excavation?
Technology improves excavation by optimizing equipment performance, reducing downtime, and increasing safety through automation and real-time monitoring.
What are the environmental impacts of Material Excavation?
The environmental impacts include land disturbance, water contamination, and habitat destruction, though newer technologies are helping reduce these effects.
Can Mineral Extraction be automated?
Yes, automation is increasingly being used in mining operations to improve efficiency and reduce human exposure to hazardous conditions.
What equipment is used for gold mining excavation?
Equipment includes excavators, haul trucks, drill rigs, and bulldozers.
How does mineral exploration affect Rock Digging?
Mineral exploration helps identify the best areas for excavation, ensuring that excavation efforts focus on high-value ore deposits.
What is the role of drilling in Mineral Extraction?
Drilling creates holes in rock for placing explosives, helping to break the rock into manageable pieces.
What are the challenges of Ore Extraction in gold mining?
Challenges include equipment failures, safety risks, and managing the environmental impact of excavation activities.
Conclusion
Material Excavation is a crucial part of gold mining, enabling the extraction of valuable ore from deep within the earth. By utilizing modern machinery and cutting-edge technology, mining operations can increase efficiency, reduce costs, and minimize environmental and safety risks. As the industry continues to evolve, the future of rock excavation looks brighter, with innovations that promise to make gold mining operations even more efficient and sustainable.
Read more about: gold-amalgam