Discover the opportunity

Barranco controls 3,200 hectares within seven 100% owned claims strategically located within Canada’s newest gold district, the Spences Bridge Gold Belt.

Download our project status report

Successful prospecting completed in prospect.

Barranco Gold – Corporate Overview

Barranco Gold Mining Corp. is a gold-focused exploration company advancing the King Gold Project in Canada’s newest gold district, the Spences Bridge Gold Belt. Barranco controls 3,200 hectares within seven 100% owned claims strategically located within this belt.

The company’s claims cover prospective stratigraphy in the southern SBGB, a 110 km northwest–trending belt of intermediate to felsic volcanic rocks dominated by the Cretaceous Spences Bridge Group.

These relatively underexplored volcanic rocks are highly prospective for epithermal style gold mineralization and low-sulphidation epithermal gold quartz veins occur throughout the range of the Spences Bridge Group stratigraphy.

Join Our Mailing List

Don’t miss out. Get the latest news first.

Why Barranco Gold?

  • Year-round exploration season in south-central British Columbia
  • Low-cost exploration compared to other jurisdictions
  • Project led by Reno J. Calabrigo, a leading expert on on the exploration of premium base precious metal assets since 1986
  • We are committed to the highest standards of environmental and social responsibility
  • We focus on generating positive outcomes and returns for all stakeholders
  • Entering the most exciting phase of exploration for early stage investors
  • Favourable capital structure with warrants providing built-in financing

Press Releases

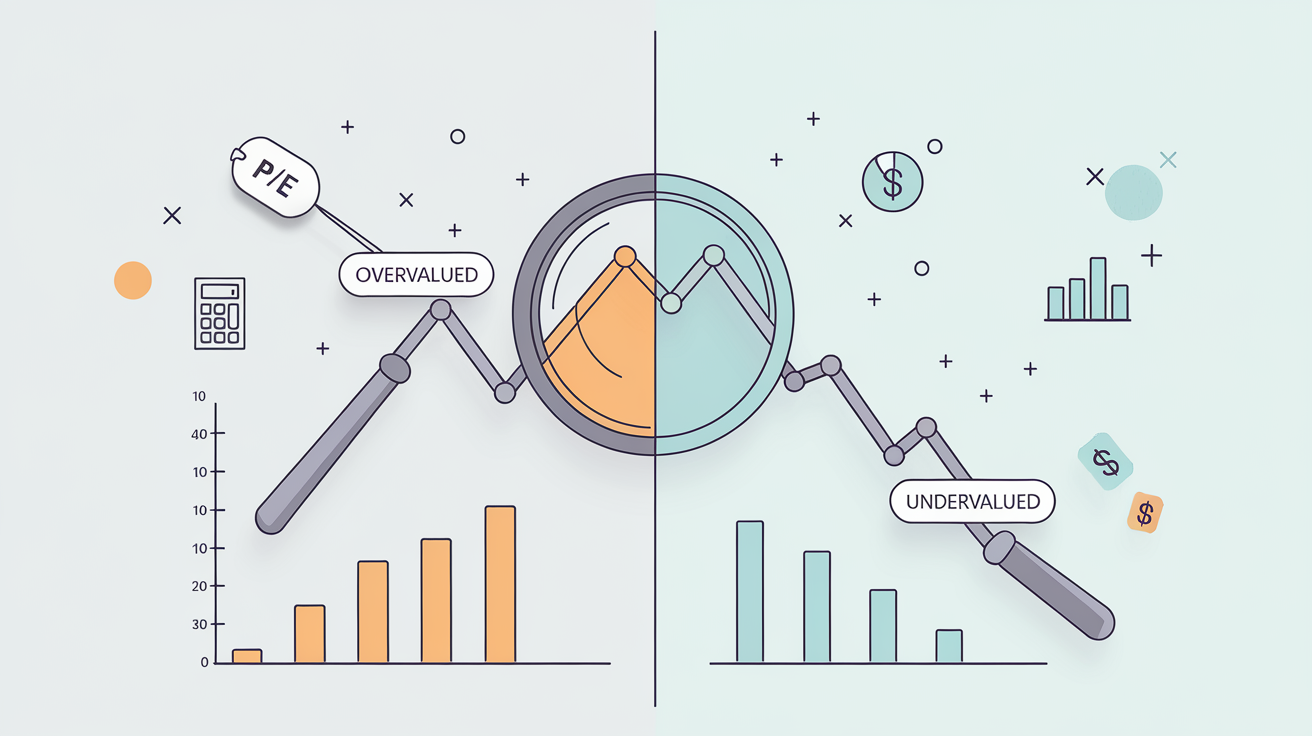
Let’s face it—stock prices don’t always tell the whole story. Sometimes, the market gets it wrong. That’s why savvy investors don’t just look at price tags; they dig deeper to understand intrinsic value. This is the true worth of a company based on its actual financial performance and potential—not just what folks are willing to pay on the stock exchange.

That’s where financial ratios come in. Think of them as quick-check tools that offer big-picture insights into whether a stock is trading for more (overvalued) or less (undervalued) than it’s really worth. Whether you’re analyzing a blue-chip giant or a scrappy start-up, ratios like P/E, PEG, and P/B can help you make sense of the numbers.

Ready to pull back the curtain on stock prices? Let’s break it down.

P/E Ratio: The Valuation Benchmark

Ah, the classic Price-to-Earnings (P/E) ratio—the first stop for most investors. It tells you how much investors are willing to pay per dollar of a company’s earnings.

Formula:
P/E = Market Price per Share ÷ Earnings per Share (EPS)

  • Trailing P/E: Based on the past 12 months’ earnings.
  • Forward P/E: Uses projected earnings for the upcoming year. 

A high P/E might suggest a stock is overvalued—unless the company has high growth potential. On the flip side, a low P/E could be a sign of undervaluation… or a warning sign of trouble ahead.

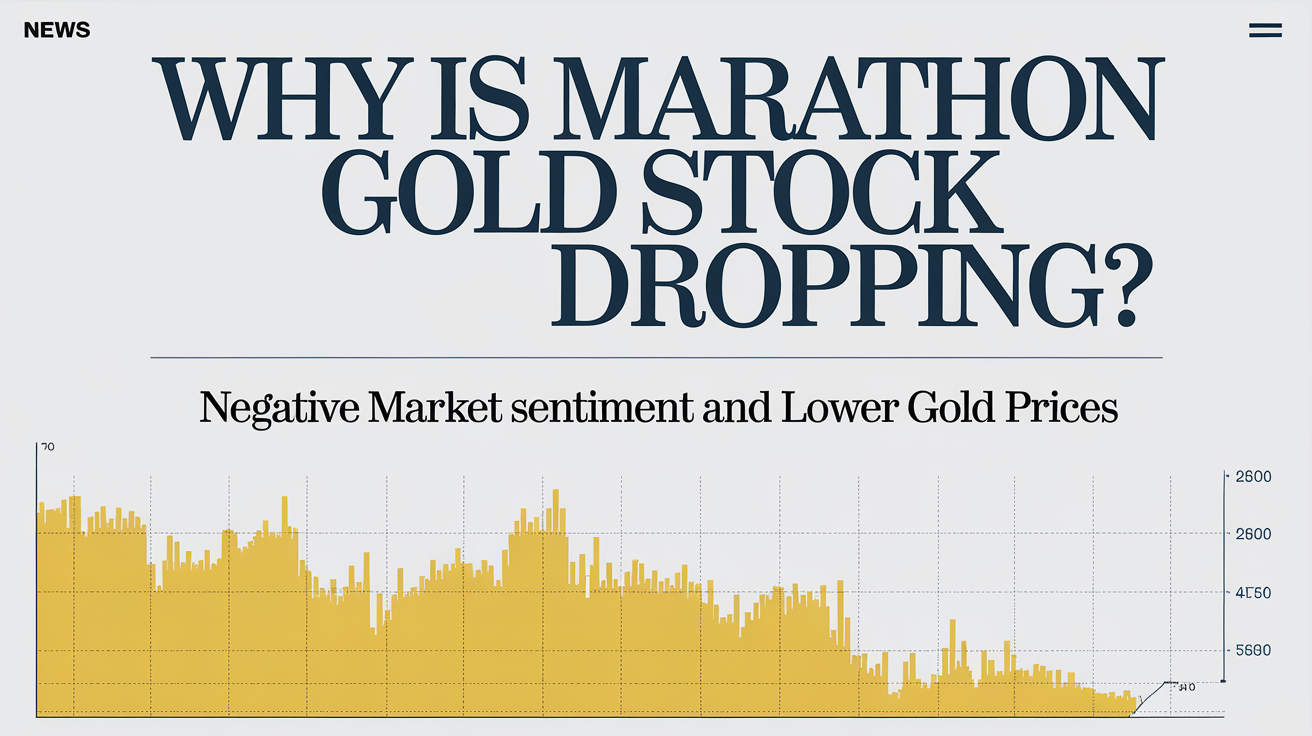
For example, undervalued gold mining stocks with strong financial ratios often stand out when compared to their industry peers. If you’re curious to see how this plays out in the real world, check out our guide to the Best Gold Stocks in Canada—a practical look at ratio analysis in the gold sector.

📌 Watch out for:

  • Comparing companies in different sectors (tech P/Es tend to be higher than industrials).
  • Using outdated earnings data. 


PEG Ratio: Adjusting for Growth

The P/E ratio’s cool cousin, the PEG ratio, adds a layer of context by factoring in growth.

Formula:
PEG = P/E ÷ Annual EPS Growth Rate

So, a stock with a PEG under 1 is often seen as undervalued relative to its growth potential. For example, a company with a P/E of 20 and expected growth of 25% would have a PEG of 0.8—pretty attractive, right?

But don’t get too excited just yet—growth projections aren’t always spot-on.

📌 Be cautious:

  • Growth rates are just forecasts, not promises.
  • The PEG is less useful for companies with volatile or unpredictable earnings. 

Price-to-Book (P/B) Ratio: Asset-Based Valuation

Want to know what you’re paying for a company’s net assets? Enter the P/B ratio.

Formula:
P/B = Market Price per Share ÷ Book Value per Share

It compares a company’s market price with the value of its tangible assets (minus liabilities). A P/B under 1 might suggest the stock is undervalued—especially if the business isn’t in distress.

But be warned: P/B is more meaningful for asset-heavy businesses like banks or manufacturers. For tech firms, not so much.

📌 Consider:

  • Sector norms (tech companies tend to have higher P/Bs)
  • Whether book value includes intangible assets like patents or goodwill 

Dividend Valuation: Price-to-Dividend Ratio

If you’re in it for income, the Price-to-Dividend (P/D) ratio is your go-to. It’s the flip side of the dividend yield and tells you how much you’re paying for each $1 of annual dividend income.

Formula:
P/D = Stock Price ÷ Annual Dividend per Share

For dividend investors, this helps identify value in income-generating stocks. A high P/D could mean the stock is overpriced for its dividend; a low P/D might scream “value.”

📌 Key checks:

  • Look at the payout ratio (is the dividend sustainable?)
  • Stability and growth of dividend payments over time 

Sector & Peer Comparison Using Ratios

Here’s the kicker—ratios mean squat without context. You’ve got to compare apples to apples.

A tech company might have a P/E of 35, while a utility might sit at 12—and both could be fairly valued in their sectors. Always compare ratios to industry averages and direct peers.

📌 Examples of context:

  • Financial sector P/B norms vs. industrials
  • Comparing dividend yields among REITs vs. telecoms 

Price-to-Sales (P/S) Ratio: Revenue-Based Indicator

The P/S ratio is a solid choice for evaluating early-stage companies or those without profits.

Formula:
P/S = Market Cap ÷ Total Revenue (or Price per Share ÷ Revenue per Share)

Since earnings can be easily manipulated, revenue offers a cleaner picture. A lower P/S suggests undervaluation, but again—context is king.

📌 Especially useful for:

  • Startups or fast-growing firms
  • Times when earnings are negative or erratic 

EV-Based Ratios (EV/S & EV/EBITDA)

If you’re doing deep-dive analysis, or thinking like a private equity firm, check out Enterprise Value (EV) ratios like:

  • EV/Sales
  • EV/EBITDA 

These consider debt and cash, giving you a more accurate picture than just stock price alone.

Why it matters:

  • Great for capital-heavy companies
  • Useful in mergers & acquisitions (M&A) or evaluating distressed firms 

📌 Quick definitions:

  • EV = Market Cap + Debt – Cash
  • EBITDA = Earnings before interest, taxes, depreciation, and amortization 

Common Pitfalls and Misinterpretations

Alright, let’s not sugarcoat it—people mess up ratio analysis a lot. Here’s what to avoid:

  • 📉 Outdated numbers: Always use the latest financials.
  • One-ratio decisions: Never base your judgment on a single metric.
  • 🔄 Cross-sector comparisons: Apples and oranges, remember? 

Ratios should guide your thinking—not make the decision for you.


Wrapping It Up

Understanding and using financial ratios doesn’t have to be complicated. These tools can help you quickly figure out whether a stock is likely overvalued, undervalued, or fairly priced. Just remember—no single ratio tells the full story. The real magic happens when you compare multiple ratios, look at industry benchmarks, and consider the company’s future growth and financial health.

So next time you’re researching a stock, don’t just trust the hype or headlines. Use these ratios to make smarter, more confident investment decisions.


In the fast-moving world of stock trading, making sense of the noise can feel overwhelming—especially for beginners. Prices fluctuate constantly, headlines scream market panic or euphoria, and it’s tough to know when to jump in or stay out. That’s where a moving average (MA) comes in.

So, what is a moving average? In a nutshell, it’s a technical analysis tool that smooths out price data by averaging it over a specific time period. It helps traders identify trends, make sense of price direction, and decide when to buy or sell.

Why do traders rely on them so much? Simple. MAs strip away the chaos and offer clarity—kind of like switching on your car’s fog lights in a storm. Whether you’re new to stocks or dabbling in day trading, learning how to use moving averages could be your first step toward smarter, data-driven investing.


What Is a Moving Average?

At its core, a moving average takes a bunch of historical prices, adds them up, and divides by the number of periods. This gives you a single line that “moves” along with price changes, smoothing out short-term volatility.

Why Not Use Raw Price Data?

Raw price charts can be messy. One day the stock jumps, the next it dives. It’s an emotional whiplash. Moving averages reduce that noise and help traders focus on the bigger picture—is the stock trending up, down, or going sideways?

Common Time Frames Used

Traders use various time frames depending on their goals:

  • Short-term: 10-day, 20-day (used for swing trading or quick trades)
  • Medium-term: 50-day (popular for momentum strategies)
  • Long-term: 100-day, 200-day (great for spotting macro trends)

Example: If a stock is trading above its 200-day MA, it’s often seen as being in a bull market.


Types of Moving Averages

Let’s break down the main types of MAs and when to use each.


1. Simple Moving Average (SMA)
  • Formula: Sum of closing prices ÷ number of period
  • Traits: Gives equal weight to all data points
  • Best for: Smoother, long-term trend tracking


2. Exponential Moving Average (EMA)
  • Formula: Adds a multiplier to give more weight to recent prices
  • Traits: More responsive to recent price action
  • Best for: Catching momentum shifts earlier


3. Weighted Moving Average (WMA)
  • Formula: Assigns linearly decreasing weights to older data
  • Traits: A balance between EMA and SMA
  • Best for: Traders who want both responsiveness and accuracy


4. Smoothed Moving Average
  • Formula: Similar to SMA but includes more historical data
  • Traits: Filters out even more noise
  • Best for: Long-term trend followers


How Moving Averages Work in Stock Trading

Alright, let’s put theory into action.

1. Identifying Market Trends
  • Rising MA: Indicates an uptrend. Buyers are in control.
  • Falling MA: Points to a downtrend. Bears have the upper hand.
  • Flat MA: Market is consolidating. Sit tight or look elsewhere.
2. Support and Resistance Levels

MAs often act like magnets for price.

  • In an uptrend, a stock might pull back to its 50-day MA and bounce—this acts as support.
  • In a downtrend, the MA becomes resistance, and price often struggles to break through.

Pro Tip: Many traders believe in the “self-fulfilling prophecy” of MAs—if enough people think the price will bounce at the 200-day line, it often does.

3. Buy Signals
  • Price moves above a key MA → Bullish signal
  • Price drops below a key MA → Bearish signal

But these signals are even more powerful when combined with crossovers, which we’ll tackle next.


Moving Average Crossover Strategies

Now we’re getting to the good stuff—how MAs actually help you buy stocks and selling them as well.

The “Golden Cross” and “Death Cross”

  • Golden Cross: When the 50-day MA crosses above the 200-day MA → Indicates a new bull trend. 
  • Death Cross: The opposite → Indicates a possible bear trend.

These are used in long-term investing and can influence massive amounts of institutional trading.

Short-Term vs Long-Term Crossovers

  • 20 EMA crossing 50 SMA: A faster signal, good for swing traders.
  • 50 SMA crossing 200 SMA: Slower but more reliable.

These crossovers serve as entry and exit points, helping you catch the start of a trend and avoid overstaying your welcome.


Pros and Cons of Moving Averages

Pros
  • Helps Identify Trends: Clear picture of where the market is headed
  • Acts as Support/Resistance: Handy reference points
  • Simplifies Decisions: Removes emotional guesswork
  • Universally Applicable: Works on any asset or timeframe
Cons
  • Lagging Indicator: Always late to the party
  • Not Great in Sideways Markets: False signals galore
  • Whipsaws: Frequent reversals in choppy conditions can hurt

Real Talk: No indicator is perfect. MAs work best when used with other tools—which brings us to the next section.


Enhancing MA Strategies with Other Indicators

If moving averages are the foundation, think of these tools as the finishing touches on your trading strategy:

1. MACD (Moving Average Convergence Divergence)
  • Based on EMAs
  • Great for spotting momentum changes
  • Confirms the strength of a trend
2. RSI (Relative Strength Index)
  • Measures if a stock is overbought or oversold
  • Pairs well with MAs for entry confirmation
3. Bollinger Bands
  • Envelops price around an MA
  • Helps you gauge volatility and breakout potential
4. Volume Analysis
  • A crossover on high volume = Strong signal
  • Low volume? Be skeptical. It could be a fake-out.
5. ATR (Average True Range)
  • Adjusts MA settings based on volatility
  • Ensures you’re not overreacting in a quiet or wild market


Wrapping Things Up: What You Should Take Away

Learning how to use a moving average to buy stocks isn’t about being perfect—it’s about being informed. When used correctly, MAs can help you:

  • Spot trends early
  • Identify support/resistance zones
  • Trigger entry/exit points
  • Manage risk and emotions
  • Combine with other tools for robust strategies

But remember, MAs aren’t magic. They’re just one part of a trader’s toolkit. The real key is combining them with sound judgment, other indicators, and solid risk management.

A junior gold miner is typically an early-stage gold exploration company engaged in the discovery and preliminary development of gold deposits. Unlike major mining firms that own producing mines and generate consistent revenue, junior mining companies primarily focus on exploring new sites and verifying the existence of economically viable gold resources. These firms often operate with smaller teams and budgets, making them akin to startups in the mining in

Core Characteristics:

  • Primarily engaged in exploration or development, not production.
  • Often possess mineral rights or leases on undeveloped sites.
  • May be in the feasibility stage—trying to prove whether a site is economically viable.
  • Operate with smaller teams, often led by geologists and mining engineers.
  • Typically listed on smaller exchanges, like the TSXV.

They’re the startup scene of the mining world—high risk, high reward, and driven by discovery. When one of these early-stage gold companies hits a major gold deposit, it can turn into a massive opportunity for investors.

Structural Criteria for Classification as Junior Gold Mining Company

Junior Gold Miner Company Classification Criteria

There’s no one-size-fits-all definition, but certain structural elements help classify them:

  • Excluded from indexes like the HUI and XAU, which track larger, established miners.
  • Projects are in the exploration or early development phase.
  • Lack of significant production or revenue—this is crucial.
  • Low market capitalization (more on that below).
  • Mostly listed on exploration-friendly exchanges like the TSX Venture Exchange (TSXV).

These companies usually haven’t crossed the development threshold that would move them into mid-tier or producer territory. Their assets are still mostly tied up in resource discovery, which means their value is speculative and driven by exploration success.

The Role of Market Capitalization in Defining Juniors

A big part of the “junior” label comes down to market cap. Most junior gold miners fall into the $1 million to $5 million range, though some may creep higher. In market terms, they’re considered micro-cap or small-cap companies.

Why does this matter?

  • Low market cap = high volatility.
  • They’re more sensitive to investor sentiment, gold prices, and funding news.
  • Typically attract retail investors and speculative capital.

They’re often listed on the TSXV, where smaller companies can more easily raise funds through equity offerings, albeit with frequent dilution.

Where Junior Miners Are Listed (Exchange Indicators)

One major clue that you’re dealing with a junior? Where they trade.

Junior miners are rarely listed on major exchanges like the NYSE or full TSX. Instead, look for:

  • TSX Venture Exchange (TSXV) – the home base for many early-stage miners.
  • OTC Markets (like OTCQB) – a U.S. alternative for international juniors.
  • ASX (Australian Stock Exchange) – another hotbed for mining startups.

These exchanges cater to exploration-stage companies, with more relaxed listing requirements and better access to venture capital.

Financing Models and Dependency on Venture Capital

Here’s the deal—junior gold miners don’t make money the usual way. Since they’re not producing gold, they can’t sell it to fund operations. So, how do they survive?

They rely heavily on:

  • Venture capital and private placements
  • Equity financing through frequent stock offerings
  • IPO funds for early capital injection

Don’t expect dividends—any money raised is reinvested into exploration. This means there’s a high capital burn rate and a constant need for new funding rounds. It’s a bit like being on a financial treadmill.

Operational vs Exploratory Status (Production vs Prospecting)

A major distinction in the gold space is exploration vs production.

Junior gold companies are squarely in the exploration phase. Their work involves:

  • Geological surveys
  • Drilling programs
  • Land acquisitions
  • Feasibility and permitting

They don’t operate producing mines. If they’re successful, they’ll either move toward development or get acquired by larger mining firms. Until then, they remain in the pre-production stage.

Ambiguity & Debate in the Term “Junior Miner”

Here’s where it gets a bit murky. Not everyone agrees on what a junior gold miner is.

There’s no universally accepted definition, and that leads to confusion. Some mid-tier producers still get lumped into the “junior” category by analysts or media. Others blur the line by operating multiple exploration and development-stage projects.

This gray area causes:

  • Analyst disagreements
  • Investor misunderstandings
  • Misclassification of mining firms

So, always check a company’s current operational status before investing.

Risk Factors Specific to Junior Gold Miners

Junior miners are exciting, but man, are they risky.

Here’s why:

  • Higher burn rate and dependency on constant funding.
  • Highly sensitive to gold price fluctuations.
  • Many never make it to production—bankruptcy is common.
  • Long delays between discovery and monetization.

If gold prices drop, exploration budgets get slashed, and juniors often take the hardest hit. That said, when gold rallies? These stocks can skyrocket.

Sample Junior Gold Mining Stocks (Real-World Companies)

Here are some junior gold miners currently listed on the TSXV:

  • Adyton Resources (TSXV: ADY) – focused on PNG-based gold exploration.
  • Montage Gold (TSXV: MAU) – West African gold explorer with multiple projects.
  • Zodiac Gold (TSXV: ZOD) – operates in underexplored regions in Africa.

These companies are in different phases of exploration and may release updates on drill results, resource estimates, or strategic partnerships—which can cause wild price swings.

Want to track them? Tools like Junior Mining Network can help.

Investing Through ETFs (Indirect Exposure to Juniors)

Not ready to pick individual junior miners? ETFs offer a way to spread the risk.

Top Junior Mining ETFs:

  • VanEck Junior Gold Miners ETF (GDXJ) – diversified exposure to global juniors.
  • Sprott Junior Gold Miners ETF (SGDJ) – includes quality small-cap names.
  • Direxion Daily Junior Gold Miners Bull 2X ETF (JNUG) – leveraged ETF for short-term bullish bets.

These funds provide:

  • Built-in diversification
  • Exposure to the junior gold cycle
    Less individual risk vs. picking one stock

Tools and Resources for Evaluating Junior Miners

Evaluating juniors takes a bit of digging (pun intended). Here are some go-to tools:

  • Junior Mining Network – daily updates and news alerts
  • Drill Result Calculators – to interpret assay data
  • Mining Screeners – like those on Yahoo Finance or TMX Money
  • Company Reports – investor presentations and feasibility studies
  • Exploration Newsletters – curated insights from geologists and analysts

Looking for red flags? Watch for management changes, lack of drill progress, and over-reliance on dilution.

Final Thoughts for Investors 

So, should you invest in junior gold miners?

If you’ve got a strong risk tolerance, a passion for speculative plays, and patience for long timelines, juniors can be exciting. They’ve got serious upside—especially in a bull gold market—but they’re not for the faint-hearted.

Tips for New Investors:

  • Diversify across a few names or use ETFs.
  • Watch for strong management teams and credible drill results.
  • Be ready for volatility and long holding periods.
  • Consider juniors as a small part of a larger gold investing strategy.


Gold has long been a trusted asset for investors seeking financial security, stability, and protection against inflation. However, with multiple investment options available, the choice between physical gold and gold funds can be complex. Should you invest in tangible gold bars and coins, or opt for more liquid, cost-effective gold-backed funds?

In this guide, we compare physical gold vs. gold funds across key investment factors such as ownership, liquidity, risk, and return potential—helping you make the best decision for your financial goals.


Why Does Gold Remain a Popular Investment Choice?

Gold has held intrinsic value for centuries, serving as a store of wealth across civilizations. Today, investors continue to favor gold for several reasons:

  • Historical Significance: Gold has been a universal currency for thousands of years, used as money and a store of value.
  • Inflation Hedge: Unlike paper currency, gold retains its purchasing power over time, making it a preferred asset during economic uncertainty.
  • Safe-Haven Asset: During financial crises, stock market crashes, or geopolitical instability, investors flock to gold as a safe-haven investment.
  • Comparison with Other Assets: Unlike stocks, gold doesn’t generate dividends, but it is less volatile than equities. Compared to real estate, it is more liquid and doesn’t require maintenance.


Physical Gold vs. Gold Funds—What’s the Core Debate?

Investors have two primary ways to gain exposure to gold:

  1. Physical gold – Buying gold bars, coins, or jewelry for direct ownership.
  2. Gold funds – Investing in exchange-traded funds (ETFs), mutual funds, or gold mining stocks.

Key considerations when choosing between these investment types:

  • Liquidity: Gold funds offer faster buying and selling compared to physical gold.
  • Security: Physical gold requires secure storage, while gold funds rely on financial institutions.
  • Cost: Gold funds may have management fees, whereas physical gold has storage and insurance costs.
  • Investor Type: Some investors prefer the tangible ownership of gold, while others opt for the ease of trading gold funds.

Let’s explore these options in detail.


What Is Physical Gold?

Investors can purchase physical gold in several forms:

  • Gold Bars vs. Gold Coins:
    • Gold bars (bullion) offer lower premiums but are harder to sell in small amounts.
    • Gold coins are more liquid and often collector-friendly but come with higher premiums.
  • Jewelry as an Investment:
    • Gold jewelry holds sentimental value, but making charges increase costs.
    • Not ideal for investment purposes due to resale limitations.
  • Digital Gold & Tokenized Gold:
    • Digital gold platforms allow investors to buy small amounts of real gold stored by a custodian.
    • Tokenized gold is a blockchain-based alternative that provides gold exposure without physical ownership.

Advantages of Investing in Physical Gold

Tangible asset with no counterparty risk – You own it outright, independent of financial markets.
Globally recognized and accepted – Gold holds value worldwide.
Privacy and personal storage options – No reliance on institutions for holding or selling.

Drawbacks of Physical Gold Investment

Storage & security concerns – Requires a home safe or bank vault for protection.
Liquidity challenges – Selling gold involves finding a buyer or dealer, often with higher transaction costs.
Lack of passive income – Unlike stocks or bonds, gold doesn’t generate interest or dividends.


What Are Gold Funds?

Gold funds allow investors to gain exposure to gold without owning physical metal.

  • Gold ETFs (Exchange-Traded Funds):
    • Directly track gold prices and trade like stocks.
    • Offer high liquidity and lower transaction costs.
  • Gold Mutual Funds:
    • Professionally managed funds that invest in gold mining companies or gold-backed assets.
  • Gold Mining Stocks:
    • Investing in companies that extract and sell gold.
    • Offers potential dividends and capital appreciation.
  • Gold Futures & Derivatives:
    • Speculative instruments for advanced traders.
    • Higher risk due to leverage.

Benefits of Investing in Gold Funds

Higher liquidity – Easily bought and sold on stock exchanges.
No need for storage or insurance – Held digitally, reducing ownership costs.
Potential for dividends – Some gold funds offer passive income through dividends.

Risks and Limitations of Gold Funds

Market volatility – Prices fluctuate with investor sentiment.
Management fees – ETFs and mutual funds charge annual fees.
Counterparty risk – Investors depend on financial institutions managing the funds.


Side-by-Side Comparison: Physical Gold vs. Gold Funds

Feature Physical Gold 🏆 Gold Funds 📈
Ownership Direct, tangible ownership Indirect (via fund shares)
Liquidity Lower—requires selling to a dealer Higher—traded on stock exchanges
Storage Costs Requires safekeeping or bank vaults No storage costs
Risk No counterparty risk but theft/storage risks Market volatility & fund management risks
Return Potential Depends on gold price appreciation May include dividends or leveraged gains
Convenience Requires physical handling and verification Easily traded online


Which Gold Investment Is Right for You?

Best for Conservative Investors & Wealth Preservation

  • Physical gold is ideal for those seeking long-term security.
  • Suitable for investors who want to hold assets outside the financial system.
  • Preferred during periods of economic instability.

Best for Active Investors & Portfolio Diversification

  • Gold funds provide easy trading and liquidity.
  • Ideal for those looking to track gold prices without dealing with storage.
  • Allows for passive management and potential dividend earnings.

A Hybrid Approach—Combining Physical Gold and Gold Funds

Many investors diversify by holding both:

✔️ Physical gold for security and wealth preservation.
✔️ Gold ETFs or mutual funds for liquidity and market exposure.
✔️ Consider tax implications – Gold funds may have capital gains taxes, while physical gold may be subject to sales tax.


Conclusion—Making the Right Gold Investment Choice

When choosing between physical gold and gold funds, consider:

🔹 Security: Physical gold offers safety from market volatility but requires storage.
🔹 Liquidity: Gold funds provide quick transactions, whereas physical gold takes time to sell.
🔹 Cost: Gold funds involve management fees, but physical gold requires storage expenses.
🔹 Investment Goals: Long-term preservation? Choose physical gold. Flexibility and easy trading? Gold funds are better.

Both investment types have unique benefits, and a balanced approach can help maximize returns while managing risk. Evaluate your financial goals, risk tolerance, and investment strategy before making a decision.


Marathon Gold Corporation (TSX: MOZ) has experienced significant fluctuations in its stock price over the past year. In November 2022, gold prices surged, nearing their record high of $2,089.20 set in August 2021. Despite this favorable market environment for gold producers, Marathon Gold’s stock failed to capitalize on these gains. Instead, the company’s stock has been on a downward trend, reflecting internal challenges and broader market conditions.

Several key factors have contributed to Marathon Gold’s struggles, including financial challenges, operational setbacks, unfavorable economic conditions, and shifting investor sentiment.

Financial and Operational Challenges Affecting Marathon Gold

Marathon Gold has faced multiple financial and operational obstacles that have negatively impacted its stock performance.

Financial Losses

The company reported a loss before tax of $620,000 in the first quarter of 2023, highlighting its ongoing financial difficulties. While gold prices remain relatively strong, Marathon Gold’s financial struggles suggest inefficiencies in cost management and revenue generation.

Project Delays and Rising Costs

One of the most significant issues facing Marathon Gold is the Valentine Gold Project, the company’s flagship venture. As of Q1 2023, the project was only 27% completed. Delays in construction and rising costs have led to increased investor concerns about the project’s feasibility and the company’s long-term profitability. If Marathon Gold fails to meet its timelines or faces additional budget overruns, the stock may continue to struggle.

Market Conditions and External Economic Factors

Macroeconomic factors and global market conditions have also played a role in Marathon Gold’s stock decline.

Gold Price Volatility

Gold prices saw a surge in late 2022, but price corrections and volatility have affected investor confidence in gold mining companies like Marathon Gold. While gold is traditionally seen as a safe-haven asset, fluctuations in price can impact mining companies’ profitability, particularly those facing high production costs and operational inefficiencies.

Relevant Read: Gold vs Gold Stocks: Which Is the Better Investment?

Global Economic Uncertainty

Inflation, changing interest rates, and economic slowdowns have created uncertainty in the mining sector. Central banks, including the U.S. Federal Reserve, have been aggressively raising interest rates to combat inflation, making gold less attractive as an investment. This shift has affected the overall demand for gold mining stocks, including Marathon Gold.

Investor Sentiment and Market Reactions

Investor perception plays a significant role in stock price movement. For Marathon Gold, market reactions have been largely negative due to several factors.

  • Analyst Ratings and Stock Downgrades: Financial analysts have expressed caution regarding Marathon Gold’s future, leading to stock downgrades and reduced price targets. Analysts often adjust their recommendations based on financial health, project execution, and market trends, all of which have been working against Marathon Gold in recent months.
  • Trading Activity and Speculation: Increased short interest and speculative trading have also contributed to stock volatility. When a stock becomes a target for short sellers, it often signals a lack of confidence in the company’s ability to generate profits in the near future. Additionally, speculative trading has led to sharp price swings, further discouraging long-term investors.

How Marathon Gold’s Projects and Operations Are Impacting Stock Price

Marathon Gold Stock

Operational challenges within Marathon Gold have further pressured its stock performance.

Valentine Gold Project Delays

As mentioned earlier, Marathon Gold’s Valentine Gold Project has experienced significant delays and cost overruns. Investors rely on strong production forecasts and timely project execution when evaluating a mining company. Any signs of setbacks in construction, permitting, or production can lead to a drop in investor confidence and stock price.

Competitor Performance and Industry Comparisons

A look at Marathon Gold’s competitors provides additional insights into its struggles.

  • Stock Performance Compared to Industry Leaders: While gold mining giants like Barrick Gold (TSX: ABX) and Newmont Corporation (TSX: NGT) have demonstrated resilience in recent years, Marathon Gold’s stock has underperformed relative to its peers. The company’s inability to maintain strong financials and execute projects efficiently has placed it at a disadvantage compared to more established players in the industry.
  • Operational Efficiency: Compared to its competitors, Marathon Gold has faced more significant operational inefficiencies. Major gold miners have managed to maintain steady production levels and control costs, whereas Marathon Gold continues to struggle with execution delays and rising expenses.

Future Outlook: Will Marathon Gold Stock Recover?

The possibility of Marathon Gold’s stock rebounding depends on several key factors.

  1. Project Execution: A turnaround for Marathon Gold hinges on the successful and timely completion of the Valentine Gold Project. If the company can accelerate construction, meet production targets, and control costs, investor confidence may improve, potentially boosting the stock price.
  2. Gold Market Conditions: If gold prices stabilize and experience a sustained upward trend, it could provide a tailwind for gold mining stocks, including Marathon Gold. However, economic uncertainty and interest rate policies will continue to play a role in determining gold’s value.
  3. Strategic Management Initiatives: The company will need to implement strong cost-cutting measures, improve operational efficiency, and communicate clear project timelines to investors. Without these initiatives, Marathon Gold may continue to face downward pressure on its stock.

Conclusion

Marathon Gold’s stock decline is driven by a combination of internal challenges and external economic factors. Financial losses, project delays, gold price volatility, and investor sentiment have all contributed to the stock’s struggles.

While the company has potential for recovery, it will need to address operational inefficiencies, control costs, and execute projects effectively to regain investor confidence. For now, Marathon Gold remains a high-risk investment, and investors should carefully evaluate the company’s future prospects before making any decisions.

Frequently Asked Questions (FAQ)

Will Marathon Gold stock go up in the future?

Marathon Gold’s future stock performance depends on factors such as project execution, gold prices, and market conditions. If the company can successfully complete the Valentine Gold Project and improve its financials, the stock may recover. However, risks remain, and investors should monitor developments closely.

Is Marathon Gold a good investment right now?

Investing in Marathon Gold carries risks due to financial challenges, project delays, and market uncertainties. While gold remains a valuable commodity, Marathon Gold’s stock performance will depend on its ability to navigate operational hurdles and external economic factors. Potential investors should conduct thorough research and assess their risk tolerance before investing.

How does gold price affect Marathon Gold’s stock?

Gold prices have a direct impact on Marathon Gold’s profitability. When gold prices rise, mining companies typically see higher revenues and improved stock performance. However, volatility and downward corrections in gold prices can negatively affect mining stocks, particularly those with high production costs or operational inefficiencies.


Canada has long been recognized as one of the world’s top gold-producing countries. The gold mining industry plays a crucial role in Canada’s economy, contributing billions of dollars annually and providing thousands of jobs. With vast reserves and rich mineral belts, Canada has cemented itself as a global leader in gold production.

Major gold mining regions in Canada include the Abitibi Greenstone Belt in Ontario and Quebec, the Red Lake District in Ontario, and the Spences Bridge Gold Belt in British Columbia. These regions are home to world-class mining projects and continue to attract investment and exploration.

Barrick Gold Corporation

Barrick Gold Corporation is one of the largest gold mining companies in the world. Founded in 1983 and headquartered in Toronto, Barrick has mining operations across North and South America, Africa, and the Middle East. The company is known for its high gold production levels and commitment to sustainability and innovation.

Barrick continues to be a top player in the global gold market, focusing on strategic acquisitions, resource expansion, and operational efficiency. The company places strong emphasis on responsible mining practices, ensuring minimal environmental impact and positive contributions to local communities.

Agnico Eagle Mines Ltd.

Agnico Eagle Mines Ltd., founded in 1957, is another major player in Canada’s gold mining sector. The company operates multiple mines in Canada, Finland, and Mexico, with a strong focus on responsible mining and environmental stewardship.

Agnico Eagle is known for its consistent production growth and strong financial performance. The company emphasizes sustainable mining practices, including reducing carbon emissions and engaging with local communities. Its commitment to high safety standards and ethical operations has positioned it as a leading mining firm in Canada and beyond.

Kinross Gold Corporation

Kinross Gold Corporation, headquartered in Toronto, is a prominent gold mining company with operations in North America, South America, West Africa, and Russia. Since its establishment in 1993, Kinross has grown significantly, focusing on high-yield gold projects and operational efficiency.

Kinross is dedicated to maintaining cost-effective mining operations while prioritizing sustainability and responsible mining. The company invests in innovation and technology to enhance production while reducing its environmental footprint. Its robust financial strategies and diverse portfolio make it a key player in the industry.

Yamana Gold Inc.

Yamana Gold Inc. is a Canada-based gold mining company with operations in Canada, Brazil, Argentina, and Chile. Established in 2003, the company has expanded rapidly and is known for its high-quality gold production and exploration efforts.

Yamana Gold focuses on operational excellence, cost reduction, and sustainability. The company invests in local communities and Indigenous partnerships to ensure responsible resource extraction. With a strong emphasis on innovation and environmental responsibility, Yamana continues to be a significant contributor to Canada’s gold mining sector.

Barranco Gold Mining Corp.

Barranco Gold Mining Corp., headquartered in Vancouver, is a growing force in Canada’s gold exploration sector. The company is focused on its flagship King Gold Project, located in the Spences Bridge Gold Belt, an emerging gold-rich region in British Columbia.

Barranco’s commitment to environmental and social responsibility sets it apart. The company follows strict ESG (Environmental, Social, and Governance) standards, ensuring sustainable mining practices and positive community engagement. With promising gold deposits and a strong exploration strategy, Barranco is well-positioned for future growth in the Canadian gold industry.

Key Gold Mining Regions in Canada

The 5 Regions Of Canada - WorldAtlas

Canada is home to some of the most prolific gold mining districts, including:

  • Abitibi Greenstone Belt (Ontario & Quebec) – One of the richest gold regions in the world.
  • Spences Bridge Gold Belt (British Columbia) – A rapidly emerging mining area, home to Barranco’s King Gold Project.
  • Red Lake District (Ontario) – Known for high-grade gold deposits.
  • Yukon and Nunavut – Increasing exploration activity and new discoveries.

These regions continue to attract significant investment and exploration efforts, ensuring a steady supply of gold from Canada.

Investment Opportunities in Canadian Gold Mining Companies

Gold mining stocks in Canada present lucrative investment opportunities. With gold prices historically performing well as a safe-haven asset, investors are drawn to Canadian mining companies.

Key investment highlights include:

  • Strong stock performance of established gold producers.
  • Potential for high returns from emerging companies like Barranco Gold Mining.
  • The impact of gold price fluctuations on mining company valuations.

Investors can explore options such as direct stock investments, gold mining ETFs, and participation in mining exploration projects.

Environmental and Social Responsibility in Gold Mining

Canadian gold mining companies have been at the forefront of sustainable mining and corporate social responsibility (CSR).

  • Many companies, including Barranco Gold Mining, follow ESG principles to minimize environmental impact.
  • Indigenous partnerships and local community engagement are key focus areas for responsible mining operations.
  • Advanced environmental policies ensure compliance with strict Canadian regulations.

Sustainable mining practices are essential for long-term industry success and public trust.

Future Trends in the Canadian Gold Mining Industry

The future of gold mining in Canada is shaped by technological advancements and increasing sustainability efforts. Key trends include:

  • AI and automation in mining operations – Improving efficiency and reducing costs.
  • Green mining technologies – Reducing environmental footprint through renewable energy and eco-friendly extraction methods.
  • Growing global demand for gold – Ensuring Canada’s continued role in the gold supply chain.

As the industry evolves, Canadian gold mining companies are set to lead with innovation, sustainability, and strong market performance.


Legal Notice

This website includes certain statements that may be deemed to be forward-looking. All statements in this website, other than statements of historical facts, that address events or developments that the Company expects, are forward-looking statements. Although the Company believes the expectations expressed in such forward-looking statements are based on reasonable assumptions, such statements are not guarantees of future performance and actual results or developments may differ materially from those in the forward-looking statements. Factors that could cause actual results to differ materially from those in forward-looking statements include availability of capital and financing, commodity prices, and general economic, market or business conditions.

Readers are cautioned that actual results or developments may differ materially from those projected in the forward-looking statements.

This news release may contain forward-looking statements based on assumptions and judgments of management regarding future events or results. Such statements are subject to a variety of risks and uncertainties which could cause actual events or results to differ materially from those reflected in the forward-looking statements, including the implementation of the arrangement as described in the circular which depends on various factors and implementation by the Company’s board of directors. The company disclaims any intention or obligation to revise or update such forward-looking statements unless required by applicable laws.

SIGN UP FOR NEWS